Skip to main contentThis section provides an overview of the analytics available for the AI Agent. You’ll find a breakdown of key performance indicators (KPIs), including session volume, user engagement, and response behavior. Additionally, it includes charts and insights on how users interact with the agent across different channels, languages, and time periods. This information is essential for understanding user behavior and monitoring agent efficiency.
In Lovi, analytics are organized into four main sections, which can be accessed through the left-hand menu:
- General Metrics: A high-level overview of sessions, users, messages, and agent performance.
- Social Listening: Insights into trending topics and conversation themes.
- Activity Report: Detailed logs of interactions, including timestamps, channels, and response times.
- NPS Report: Net Promoter Score analysis based on user feedback and satisfaction ratings.
These sections allow you to monitor both operational performance and user perception in a centralized, easy-to-navigate dashboard.
General Metrics
The General Metrics section allows you to view and analyze your data across various performance indicators and dimensions. It is divided into four tabs:
- Main Dashboard
- Agent Analytics
- Voice Analytics
- Real Time
Main Dashboard
 The Main Dashboard tab offers a high-level overview of your AI Agent’s activity. It is structured into multiple sections, each focusing on different aspects of the user-agent interaction. You can filter the data by start date, end date, channel, and language to narrow down the analysis and focus on specific timeframes or user segments.
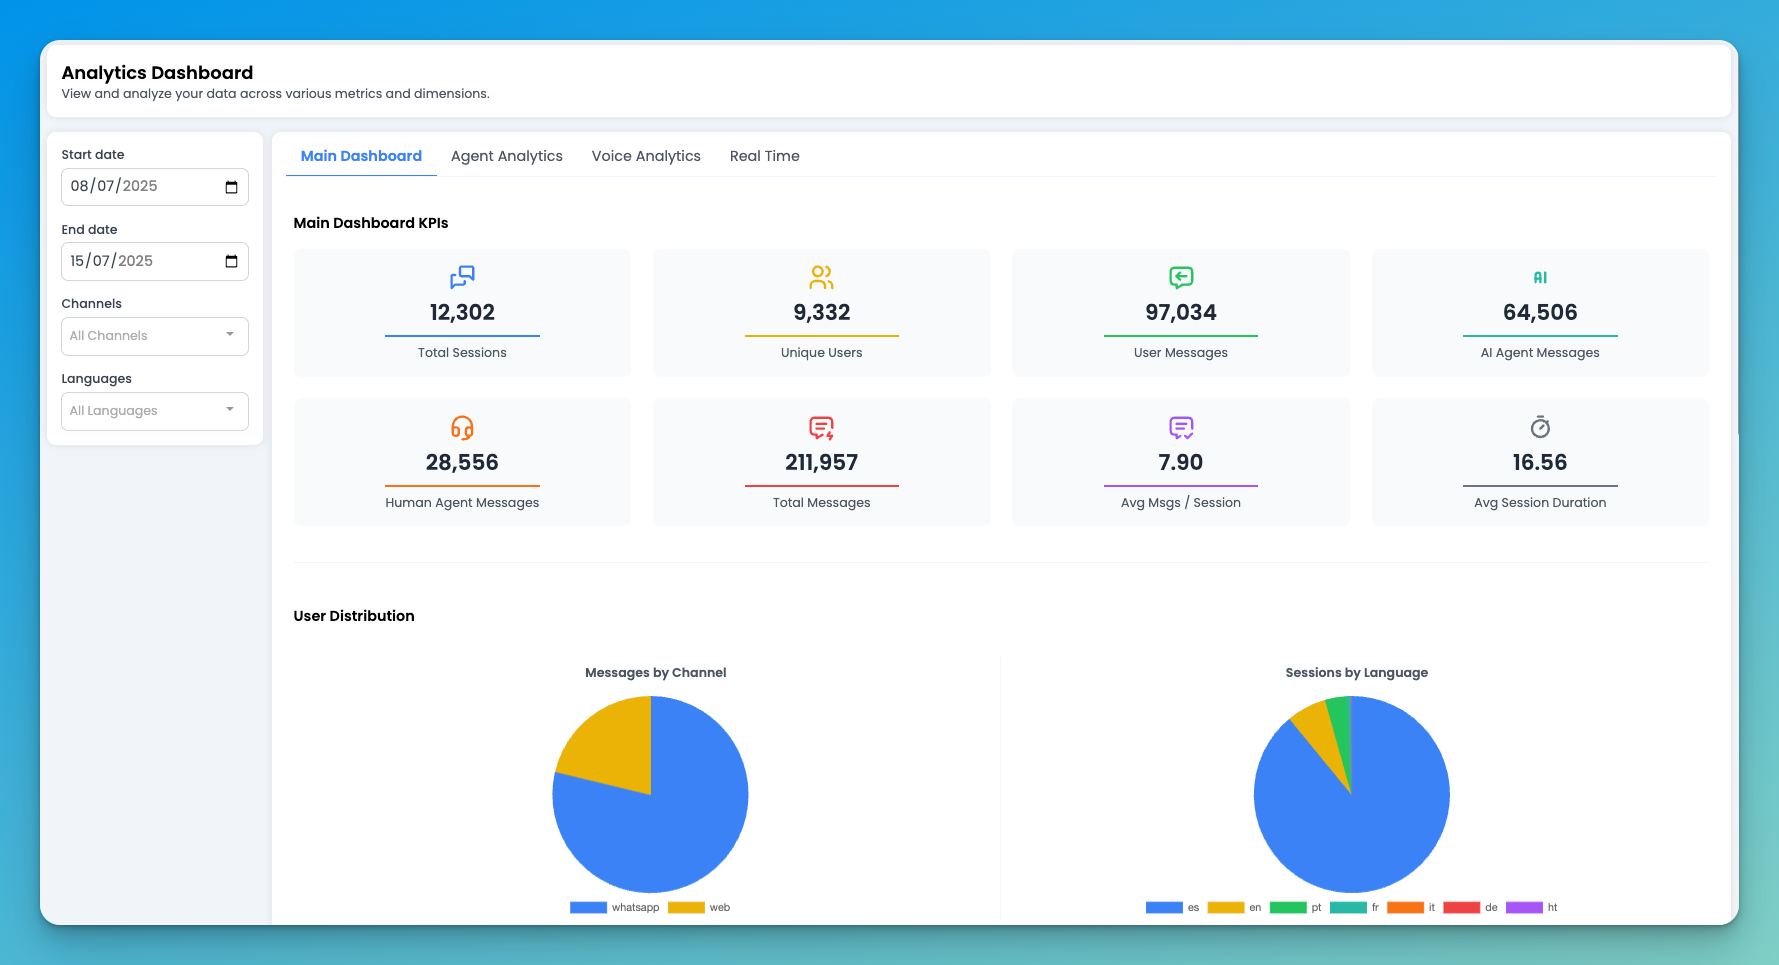
Main Dashboard KPIs
This section highlights the core Key Performance Indicators (KPIs) that summarize the agent’s performance and user engagement over a selected time range:
- Total Sessions: Total number of user sessions initiated.
- Unique Users: Number of distinct users who interacted with the AI Agent.
- User Messages: Total messages sent by users.
- AI Agent Messages: Total messages generated by the AI Agent.
- Human Agent Messages: Messages sent by a human agent (if handover occurred).
- Total Messages: Combined number of all messages in both directions.
- Average Messages per Session: Average number of messages exchanged in a session.
- Average Session Duration: Mean length of user sessions, measured in minutes.
These KPIs offer a quick snapshot of how users are interacting with the agent and how the system is performing over time.
User Distribution
The User Distribution section provides insight into how users are interacting with the AI Agent across different platforms and languages. It includes two pie charts:
- Messages by Channel: Displays the proportion of messages exchanged through each channel, such as web, voice, WhatsApp, etc.
- Sessions by Language: Shows the distribution of sessions by the language used in each conversation.
By hovering over each segment of the chart, you can view the exact figures and percentages, allowing for quick identification of the most active channels and preferred languages among users.
Time Distribution
The Time Distribution section presents a set of visualizations that help you understand when interactions with the AI Agent are taking place and how the agent performs over time. It includes the following charts:
- Session Time Distribution (24h): Displays session volume by time of day. The Y-axis shows sessions grouped by hour, and the X-axis represents the hours in 24-hour format.
- Daily Session Distribution: Shows the number of sessions per day. The Y-axis displays the session count, and the X-axis shows the date in yyyy/mm/dd format.
- Hourly Message Volume: Highlights how many messages are exchanged each hour. The Y-axis shows the number of messages, and the X-axis represents the time of day in 24-hour format.
- Agent Response Time Analysis: Displays the AI Agent’s average response time (in seconds) throughout the day. The Y-axis indicates the response time, and the X-axis shows the hours in 24-hour format.
For all charts, you can hover over each data point to see the exact values and gain deeper insights into user behavior and system responsiveness.
Agent Analytics
 The Agent Analytics tab focuses on the performance and workload of human agents involved in user conversations. You can filter the data by start date, end date, and agent to analyze specific time periods or agent. It is divided into four key sections:
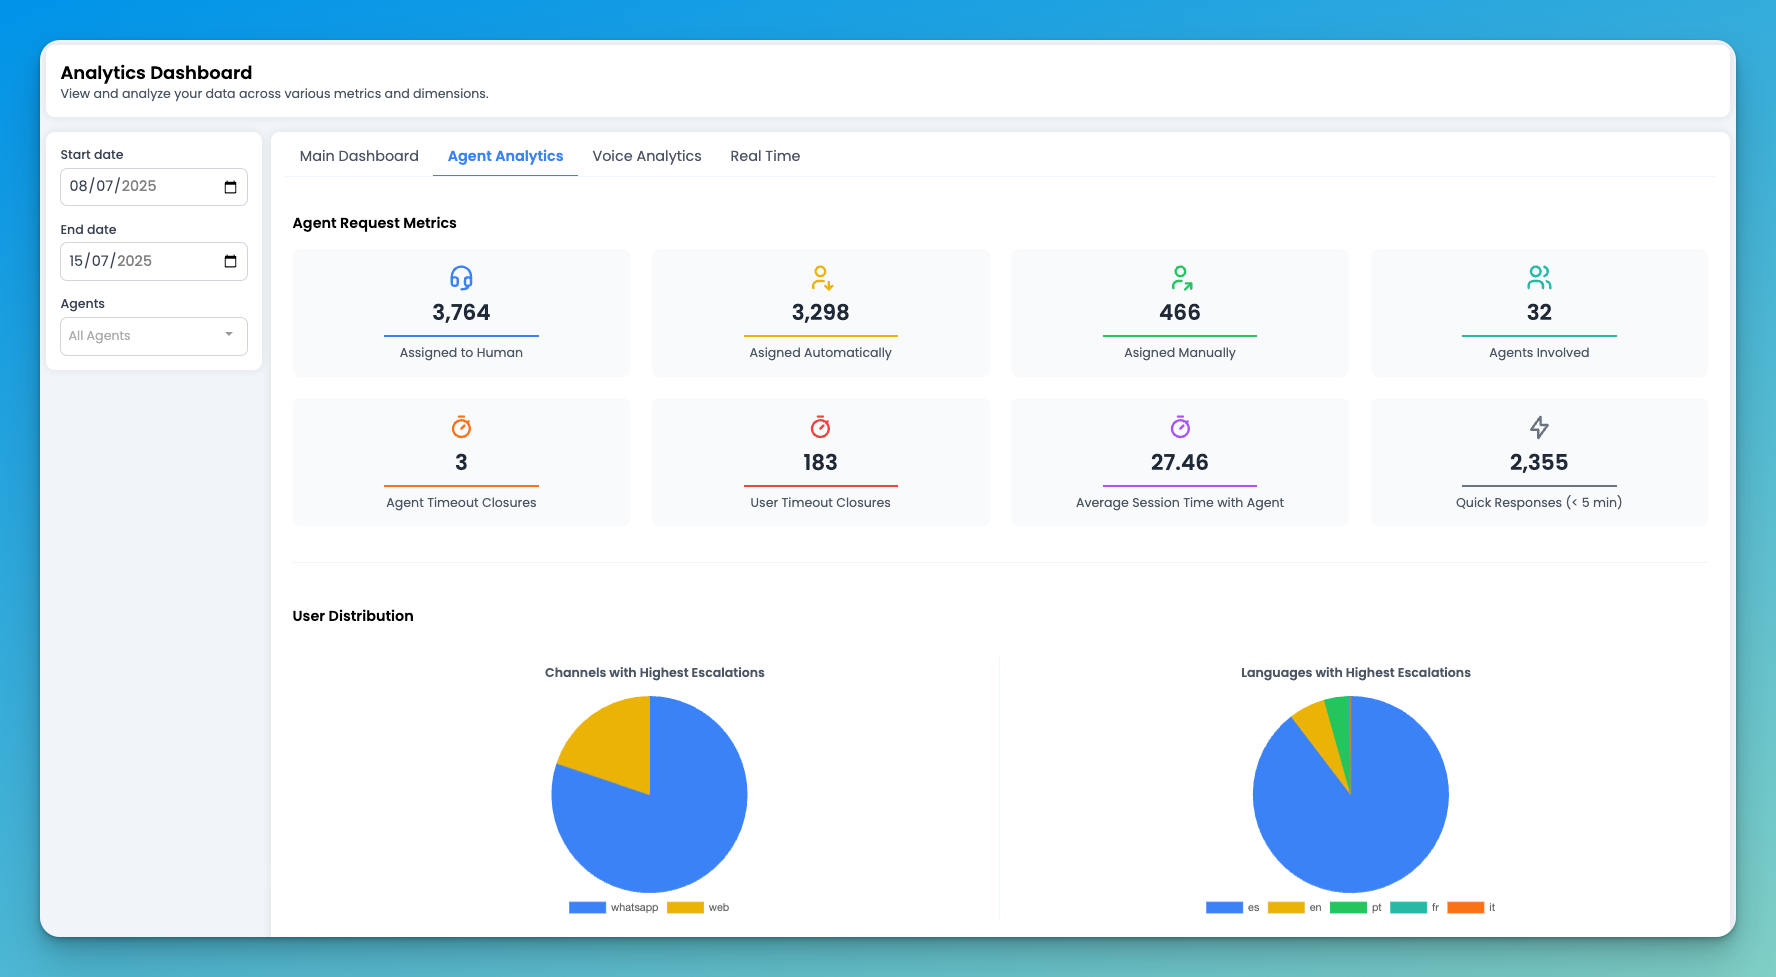
Agent Request Metrics
Displays high-level data on how sessions are escalated and handled by agents. Metrics include:
- Assigned to Human
- Assigned Automatically
- Assigned Manually
- Agents Involved
- Agent Timeout Closures
- User Timeout Closures
- Average Session Time with Agent
- Quick Responses (under 5 minutes)
User Distribution
Highlights the distribution of escalations by:
- Channels with Highest Escalations
- Languages with Highest Escalations.
This helps identify where most handovers to human agents are taking place.
Agent Detailed Metrics
Provides agent-level performance data, including:
- Chats Assigned by Agent
- Average Chat Time per Agent (minutes)
- Chats Closed per Agent
- Total Connection Time per Agent
- Agent Availability (hours). Different agent statuses are represented with distinct colors: Online, Break, Ending Shift, and Training. This visualization helps you clearly identify each agent’s availability throughout the day.
Agent Time Distribution
Visualizes the distribution of agent activity over time:
- Agent Time Distribution by Hour
- Agent Time Distribution by Day.
These charts help you understand agent coverage and workload trends. Each chart allows you to hover over the data points to view exact values for more precise analysis.
Voice Analytics
The Voice Analytics tab provides insights into the performance and quality of voice interactions handled by your AI Agent. You can filter the data by start date and end date to focus on specific timeframes. These metrics are essential to evaluate both user experience and system performance in voice-based interactions.
This tab includes the following sections:
Voice KPIs
Displays key performance indicators related to voice calls, including:
- Total Calls
- Average Call Duration (min)
- Total Call Duration (hours)
- Successful Scored Calls
- Success Rate (%)
- High Stress Calls (%)
- Average Talk Duration (seconds)
Average Score Distribution
Visualizes the distribution of average scores assigned to calls, helping assess overall call quality.
Call Trends
Shows how voice call volume and performance evolve over time, helping you identify patterns, spikes, or drops in activity.
Real Time
 The Real Time tab provides a live snapshot of ongoing activity within your AI Agent ecosystem. It helps monitor operational dynamics and agent performance in real time. The data can be used to make immediate decisions and optimize live support.
This tab includes two main sections:
The Real Time tab provides a live snapshot of ongoing activity within your AI Agent ecosystem. It helps monitor operational dynamics and agent performance in real time. The data can be used to make immediate decisions and optimize live support.
This tab includes two main sections:
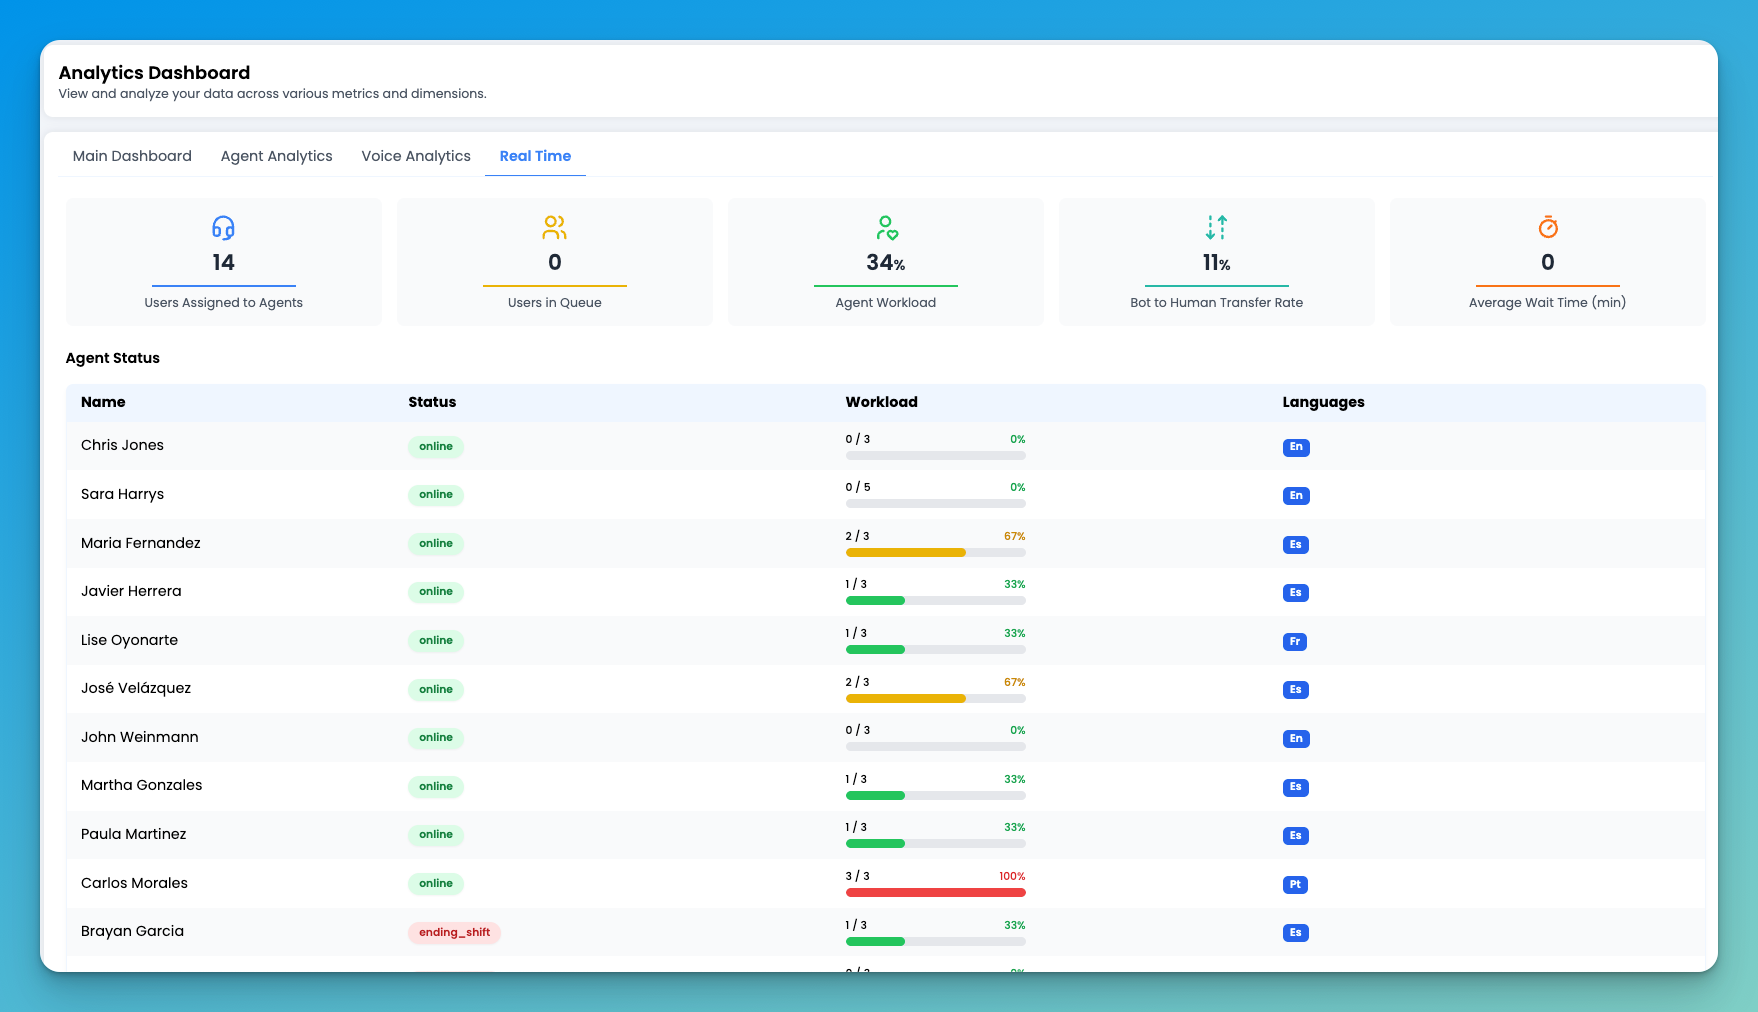
Live Metrics
Displays real-time figures for:
- Users Assigned to Agents
- Users in Queue
- Agent Workload
- Bot to Human Transfer Rate
- Average Wait Time (min)
Agent Status
Lists individual agents with the following information:
- Name
- Status (e.g., Online, Offline)
- Current Workload
- Languages each agent is assigned to handle
This section is especially useful for supervisors who need to track availability and workload at a glance.
Social Listening
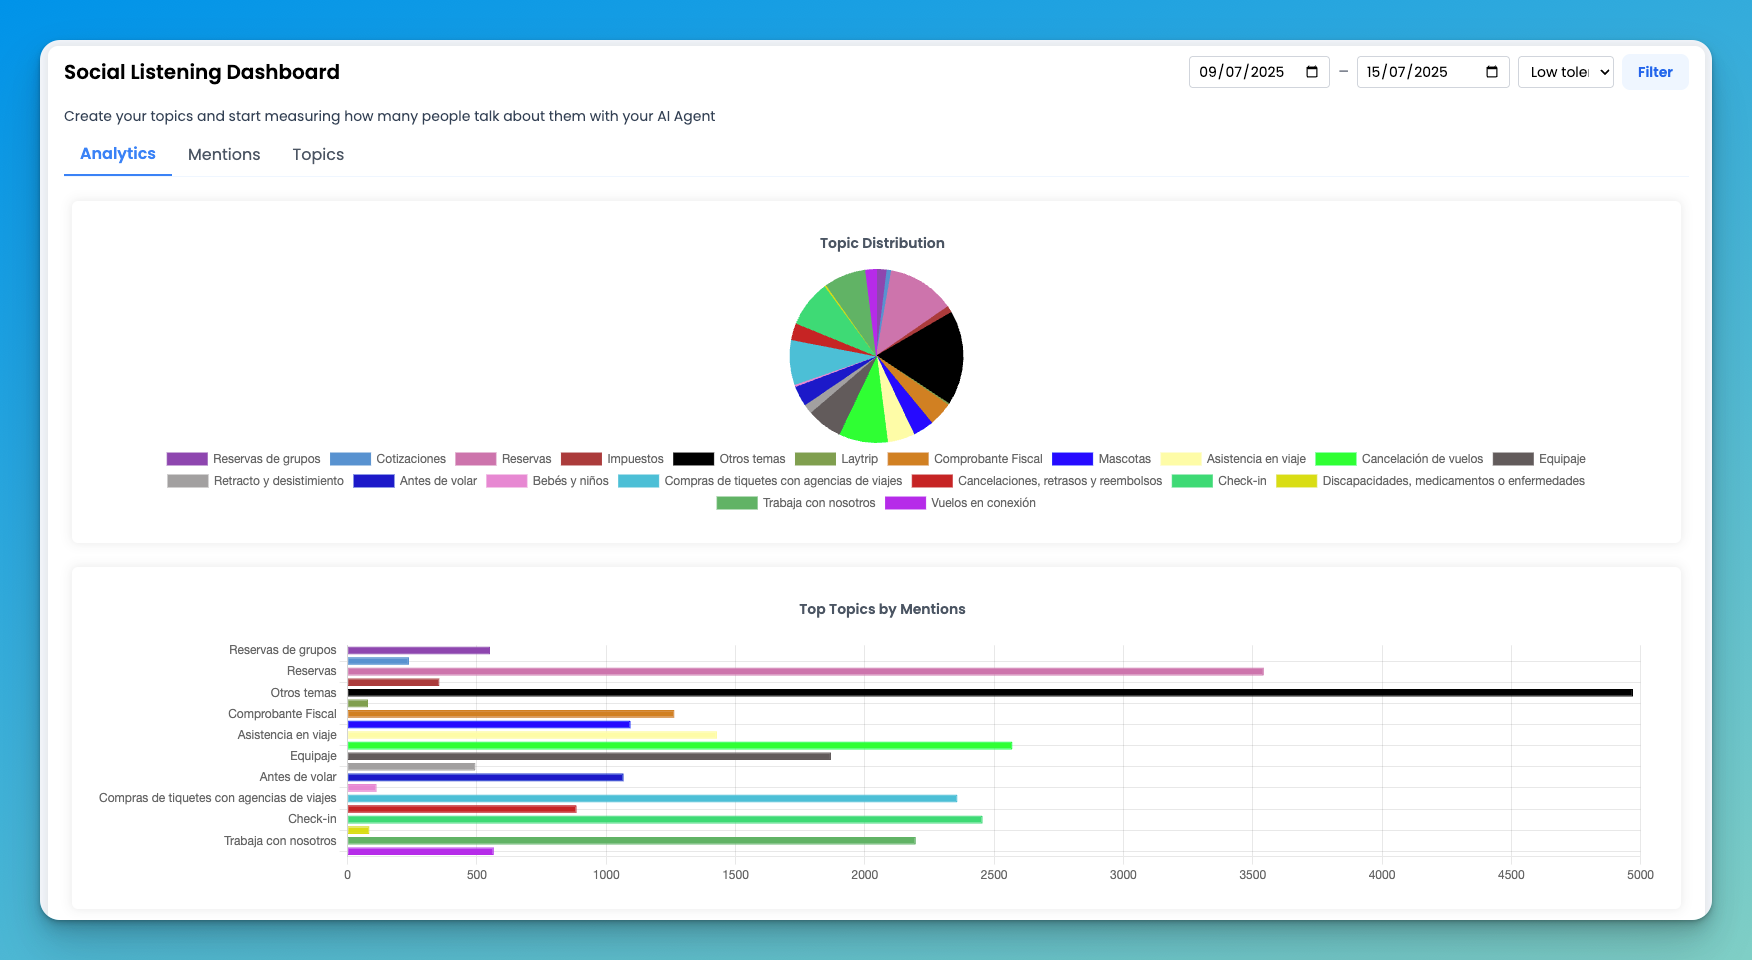 The Social Listening section allows you to track and measure how frequently users mention specific topics in conversations with your AI Agent. You can define your own custom topics and monitor how relevant they are across interactions.
You can filter the data by start date, end date, and tolerance level (Low Tolerance, Medium Tolerance, High Tolerance), which adjusts the sensitivity of the matching algorithm.
This section includes three tabs:
The Social Listening section allows you to track and measure how frequently users mention specific topics in conversations with your AI Agent. You can define your own custom topics and monitor how relevant they are across interactions.
You can filter the data by start date, end date, and tolerance level (Low Tolerance, Medium Tolerance, High Tolerance), which adjusts the sensitivity of the matching algorithm.
This section includes three tabs:
- Analytics: Offers aggregated data and visualizations to help you understand topic trends and volumes.
- Mentions: Displays individual message snippets where specific topics were detected.
- Topics: Allows you to create, edit, and manage the list of topics you want to monitor.
This feature is particularly useful for identifying recurring concerns, market trends, or product feedback based on user language.
Analytics Tab
The Analytics tab provides a visual summary of how your defined topics are being mentioned in conversations. It includes the following components:
- Topic Distribution: A pie chart showing how mentions are distributed across all tracked topics.
- Top Topics by Mentions: A bar chart displaying the number of mentions for each topic. You can hover over each bar to view the exact number of mentions.
- Evolution of Topics: A line graph that shows how topic mentions evolve over time, helping you identify trends and spikes in interest on specific dates.
These insights make it easy to understand what users are talking about most and how those conversations change over time.
Mentions Tab
The Mentions tab provides a detailed view of how each topic is being referenced in user conversations.
You’ll see a list of all configured topics along with the corresponding number of mentions. By clicking on a specific topic, you can expand it to view the individual conversations where the topic was detected. Each entry includes the user message, username, date, and time of the interaction.
This tab is especially useful for reviewing the exact context in which topics are mentioned and for identifying patterns or recurring concerns.
Topics Tab
The Topics tab allows you to manage the list of topics you want to track in conversations with your AI Agent.
From this tab, you can create, edit, and delete topics as needed. You can also configure the visibility of each topic, choosing whether it should be actively monitored and included in analytics.
This flexible setup enables you to tailor the social listening function to your specific use cases and business goals.
Activity Report
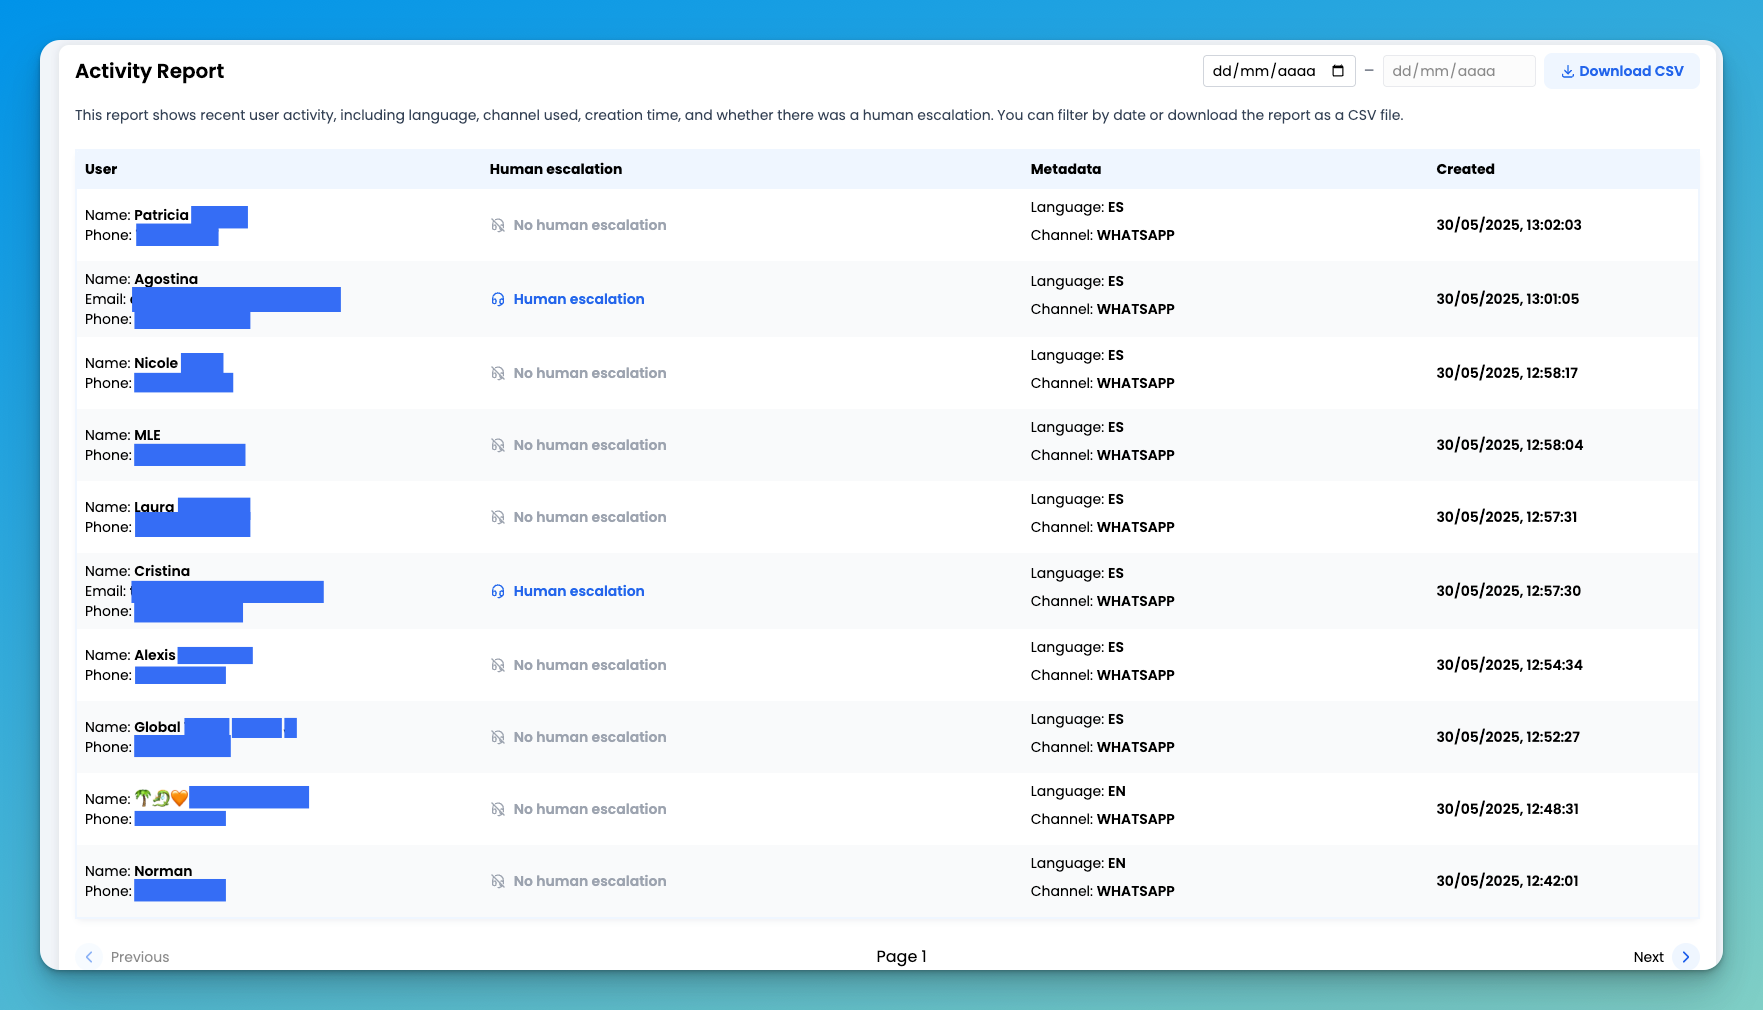 The Activity Report provides a detailed log of recent user interactions with your AI Agent. It includes key information such as the language used, the communication channel, the timestamp of the session, and whether the conversation was escalated to a human agent.
You can filter the report by start date and end date, and also download the data as a CSV file for further analysis.
The table includes the following columns:
The Activity Report provides a detailed log of recent user interactions with your AI Agent. It includes key information such as the language used, the communication channel, the timestamp of the session, and whether the conversation was escalated to a human agent.
You can filter the report by start date and end date, and also download the data as a CSV file for further analysis.
The table includes the following columns:
- User: Identifies the user involved in the interaction.
- Human Escalation: Indicates whether the session was escalated to a human agent.
- Metadata: Displays the language of the conversation and the channel used (e.g., web, voice, WhatsApp).
- Created: Shows the date and time when the session was initiated.
This section is useful for auditing interactions, monitoring escalation patterns, and analyzing user behavior over time.
NPS Report
The NPS Report section allows you to measure user satisfaction by setting up and analyzing Net Promoter Score (NPS) surveys. NPS is a widely used metric that helps you understand how likely users are to recommend your service, based on their experience with your AI Agent or human support.
You can filter results by start date and end date, and create new NPS surveys using the Create NPS Survey button.
When creating a new survey, you can configure the following fields:
- Channels: Select which communication channels (e.g., web, WhatsApp, voice) the survey will apply to.
- Conversation Type Policy: Define the type of conversation that should trigger the survey. The available options are:
skip_if_agent: the survey will be skipped if the conversation involved a human agent.only_if_agent: the survey will only be sent if a human agent participated in the conversation.none: the survey will be sent regardless of human involvement.
- Delay Minutes: Specify how long to wait before sending the survey after the interaction ends.
- Enter Flow: Choose the flow or path the user will follow when completing the survey.
- Message Mapping: Map each step of the survey to specific messages that will be shown to the user.
This section is ideal for continuously collecting feedback and identifying areas for improvement in your customer service experience.